Measured in the clinic, protected in everyday life.
Lines, not pointsA few tests a year, and every day in between.
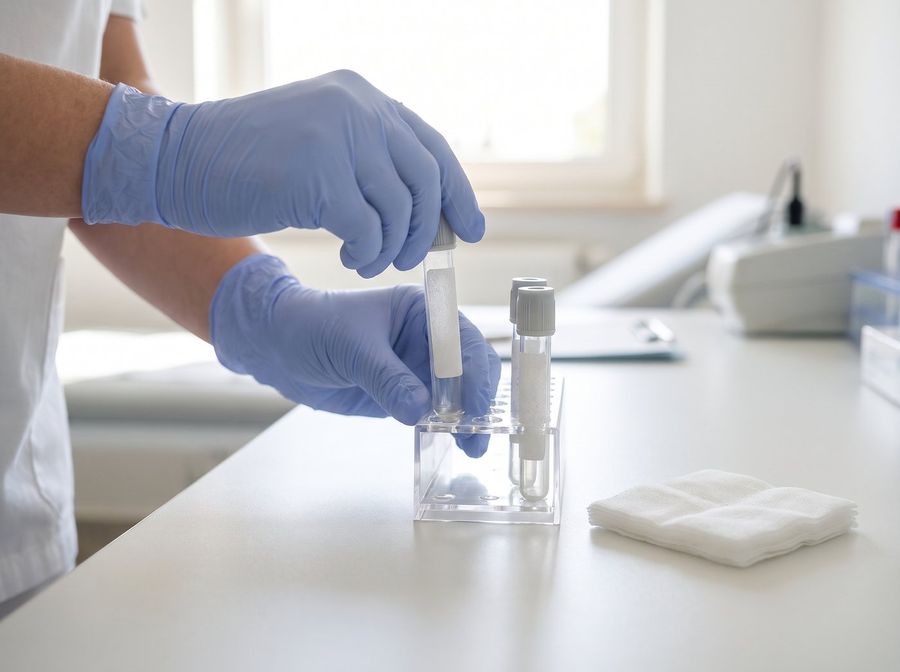
The photograph of blood tubes and a fitness band is an illustrative image generated with AI.
Longevity and healthspan
Living longer and living in good health are not the same thing. Longevity science starts from the gap between the two.
LongevityA long life
longuslong+aevumage, lifetime
From the Latin longaevitas. The word has been used in English since the early seventeenth century.
HealthspanYears lived in good health
healthgood health+spana length of time
The counterpart of lifespan. There is more than one way to measure it. Japan's official figure is the average period lived without limitation in daily activities, while the WHO uses health-adjusted life expectancy, which discounts years lived with disease or disability.
The gap between lifespan and healthspan (Japan, 2022)
Men
Healthy life expectancy 72.57 yearsGap 8.49 yearsLife expectancy 81.05 years
Women
Healthy life expectancy 75.45 yearsGap 11.63 yearsLife expectancy 87.09 years
Source: Japan's Ministry of Health, Labour and Welfare, healthy life expectancy for 2022 (published December 2024, in Japanese) and the 2022 abridged life table. The gaps are the ministry's published figures.
Measured with the WHO's own indicator across 183 member states, the worldwide gap widened from 8.5 years in 2000 to 9.6 years in 2019 (Garmany and Terzic, JAMA Network Open, 2024).
Blue Zones
We look at behaviours, not at “longevity regions”
Blue Zones are regions said to have unusually many long-lived people. The term was used in a 2004 paper that reported an area in the mountains of Sardinia, Italy, where an unusually high share of people reached the age of 100.
The reliability of the age records has been questioned. The demographers behind the term reply that the ages were cross-checked against several independent sources, and the debate continues. So we do not say that any region is a place where people live longer. We take the behaviours that have been described in those regions one at a time, and check each against its own research.
People with stronger social relationships were more likely to survive than those with weaker ones (odds ratio 1.50), across 148 studies and about 309,000 people.
People who did about 150 minutes a week of moderate-to-vigorous activity outside work had a lower risk of death than those who did none (relative risk 0.69). The review as a whole covered 94 cohorts and more than 30 million people.
Each extra 200 g a day of vegetables and fruit was linked to a lower risk of death (relative risk 0.90). The figure pools 15 of the 95 studies in the review.
All four come from studies that follow people over time. They show associations, not cause and effect.
Our thinking
Blood and urine tests, a few points a yearThe daily record from a wearable, a continuous lineA flag on a small day-to-day change (a prompt to look, not a diagnosis)
A schematic. The shape is an illustration, not real data.
Lines, not points
A clinic visit or a blood test a few times a year is a single point in time. Health is decided on the days in between, by where you live, what you eat, how you sleep and work, and the environment around you. We see the clinic as the place for measurement and education, and we want the interventions themselves to reach into daily life.
Blood as the reference, wearables for early signals
We treat blood and urine tests as the reference. We intend to examine how closely they correspond with what a wearable records around the clock, such as sleep, heart rate variability and activity. From there, our research aim is to define the job that only a wearable can do, which is to flag small day-to-day changes early. We want that flag to be used in medical and wellness settings as a prompt to look more closely, never as a diagnosis.
Health that happens while you live
For most people, a major change of routine for the sake of their health does not last. So we look at the surroundings instead: light, sound, scent and temperature when you get home, and gentle nudges in how the day is spent, so that your environment looks after your health while you get on with living. This is the thinking behind environmental medicine, where vital signs and personal data are used to design environments as well as to develop medicines.
How a flag worksIf a change from your usual pattern persists, you get a note
Blood tests happen a few times a year. In between, a wearable records every day. When those readings stay outside a person's own usual range, we want the system to say so. We call this a flag.
Example: resting heart rate over 14 days
The person's own usual range, set from their past readings
Higher than usual for five days in a row
The flag is raised here
A sample notificationYour resting heart rate has been higher than usual for five days
This overlaps with a drop in your sleep quality. If it continues, ask your doctor whether to bring your next blood test forward.
This is a sample. The shape is an illustration, not a real person's data. A flag is a prompt to look more closely, not a diagnosis.
01
Measure
Blood and urine tests set the baseline.
02
Track
Everyday data from a wearable shows what changes.
03
Intervene
Through the home, food and environment.
04
Measure again
Check what changed, then go round again.
What a day could look like
This is the day we are working towards. It does not exist yet. What we provide today is the blood analysis report. Everything else described here still has to be worked out through discussion and research.
06:30
Waking
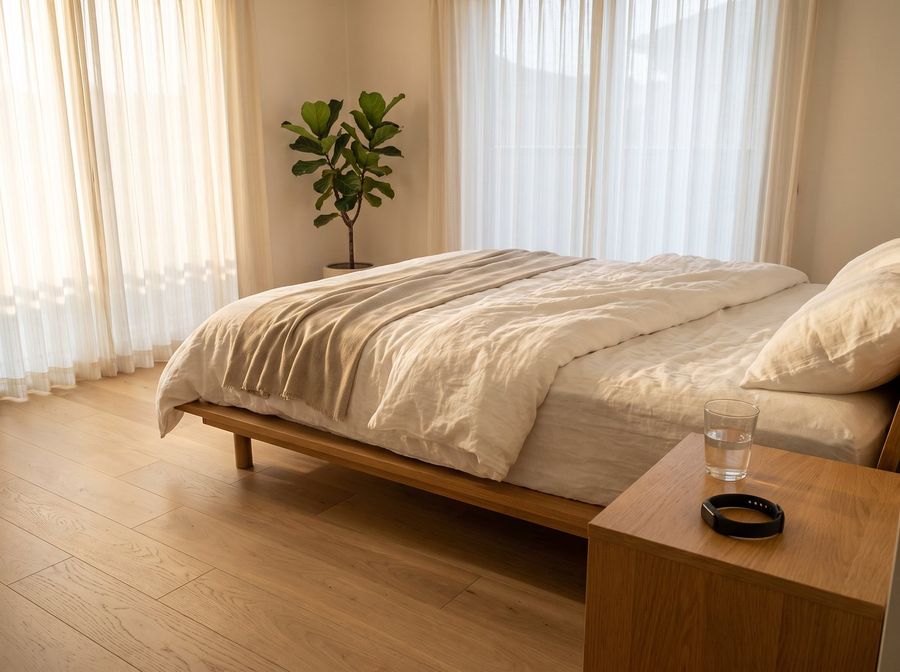
Your sleep, breathing and heart rate overnight have already been recorded by the time you get up.
Daytime
Out and about
A wearable follows heart rate variability and activity. After a short night, a note arrives: go easy on hard exercise this evening.
19:00
Coming home
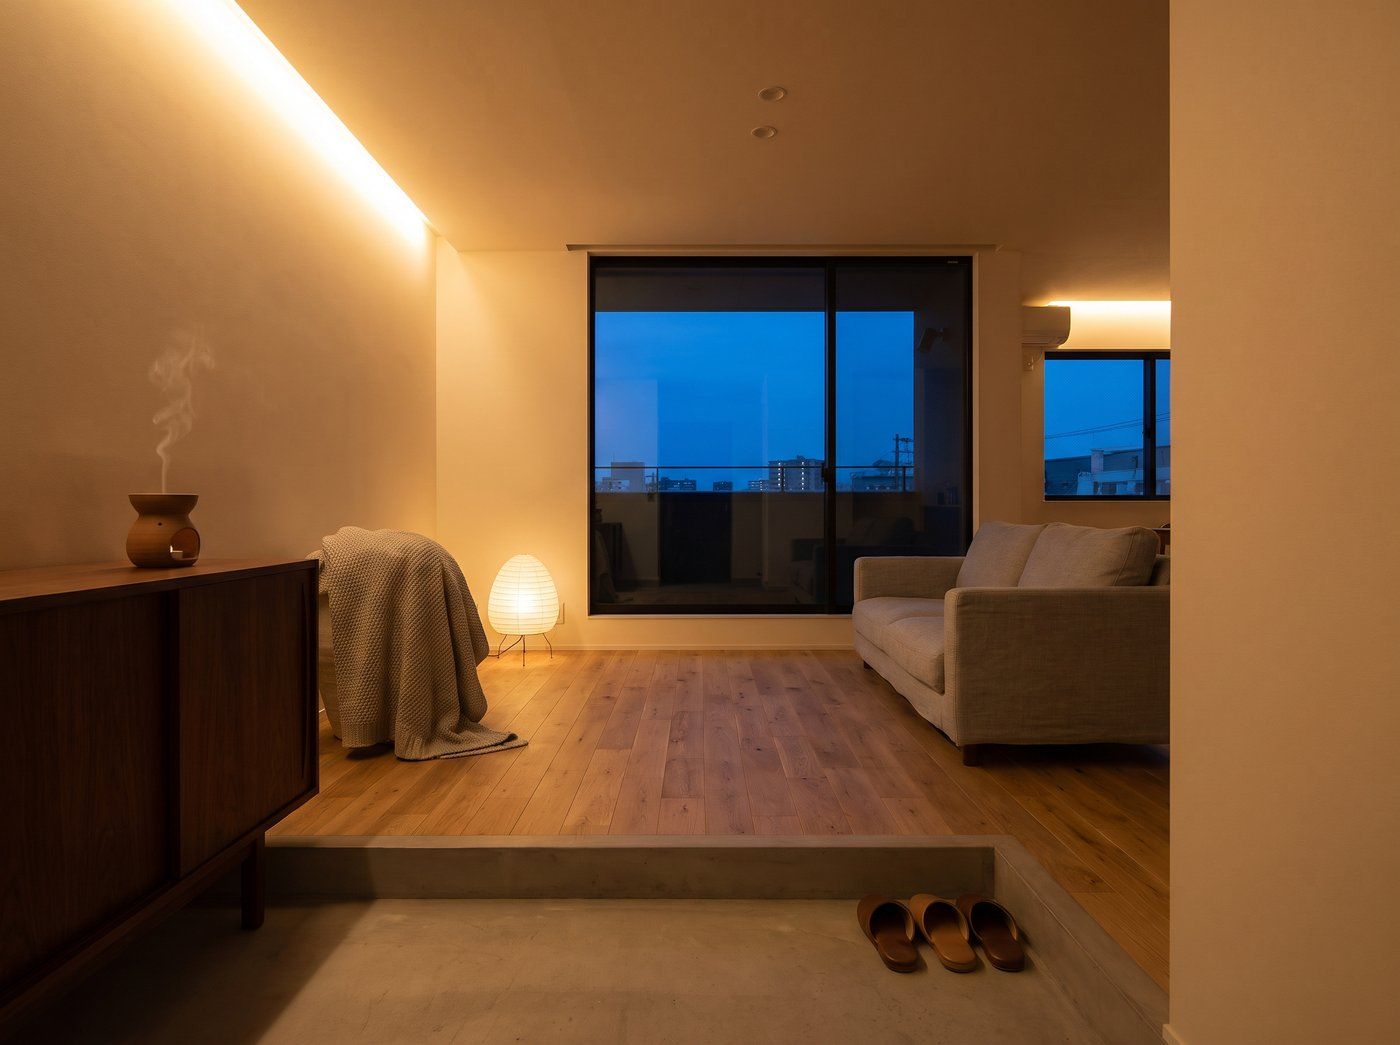
The colour of the lighting, the scent and the sound have been set to suit the day's data.
22:30
Bedtime
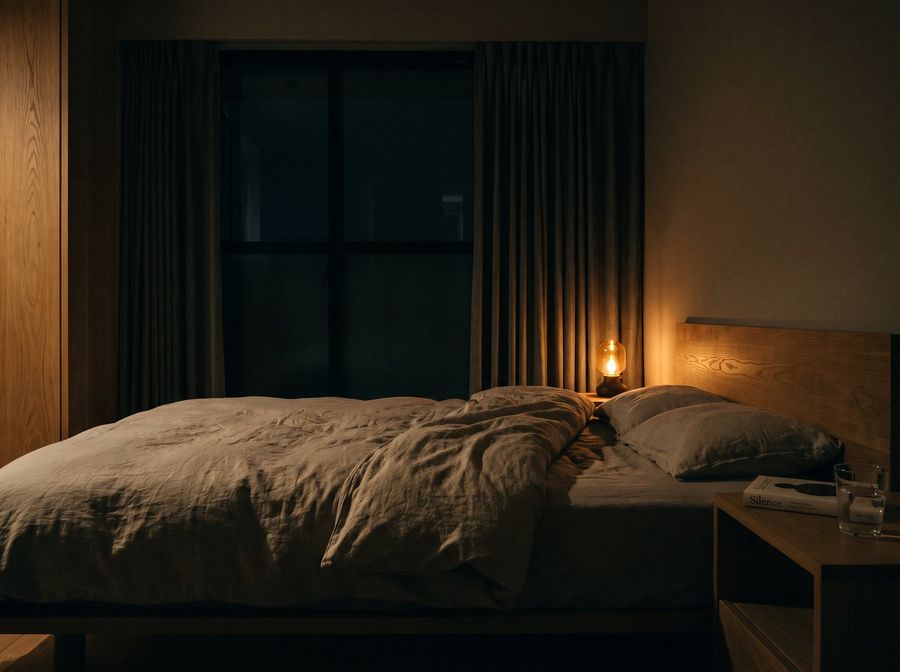
The light turns warmer and the bedroom cools.
Every three months
Blood test
A doctor reviews the results, and a report arrives that sets them against your everyday data. At the clinic, you talk the results through with your doctor.
The photographs are illustrative images generated with AI.
The clinic sees you a few times a year. Your home is there every day, and it is the home that can act on light, scent, sound and temperature.
Why changing behaviour matters, and why it is hard
There is more health data than ever. What is missing is the line that connects it to what people do. Test results and good information are often not enough on their own to change behaviour.
01
Why it matters
Test results and a well-designed environment only matter once they show up in how a person spends their days. The change need not be large, but it has to last.
02
Why it is hard
Knowing that something is good for you does not make it easy to keep up. Anything that relies on willpower breaks down on a busy day or a bad one.
03
Make it fun to join in
You find you have joined in, and you keep going because you enjoy it. We aim to build that kind of design into homes, workplaces and apps, using points, game elements and doing things together with others.
Design rules
Three rules we design by
Reward action and improvement
We reward what people do and how far they have improved, not how good their numbers are. That way, someone living with an illness is not put at a disadvantage.
Compare rates of improvement
We compare the rate of change, not the absolute value. Someone in their seventies can beat someone in their thirties.
Rest counts too
Choosing to skip exercise on a day when the body is tired is a good decision, and we treat it as one.
In a US randomised trial of 602 adults with a BMI of 25 or more, three versions of a 24-week step-count game were tested, built on support, collaboration or competition. The competition group increased its daily steps by about 920 more than a group that only received feedback from a wearable. Once the game ended, steps fell in every group, and over the following 12 weeks only the competition group stayed ahead (Patel MS, et al. JAMA Intern Med. 2019). The open question is how to design something that lasts.
We believe contact with nature and soil matters for healthy longevity. The research is still limited, so we set out what is known and what is not.
Green space near home
More greenery, lower mortality
This is the pooled result of nine studies following about 8.3 million people in seven countries. They are cohort studies, so they cannot show that the greenery is the cause.
Contact with soil changed skin bacteria and immune markers
In a one-month randomised, placebo-controlled trial, adults grew edible plants indoors in soil rich in microbes. Compared with a group given soil poor in microbes, the variety of bacteria on their skin increased, and one of the seven immune markers measured, IL-10, rose. A 28-day study in Finnish nurseries (75 children aged three to five, not randomised) covered the playgrounds with forest floor and turf and found similar changes.
There is a good deal we do not know. In the research we have looked at, no trial has followed people as far as disease or lifespan. Why these changes happen, and whether microbes alone explain them, is still open. It is one of the questions we want to test.
Time in natureA walk in the woodsLooking upBy the sea
What we are working on
01
Blood analysis report
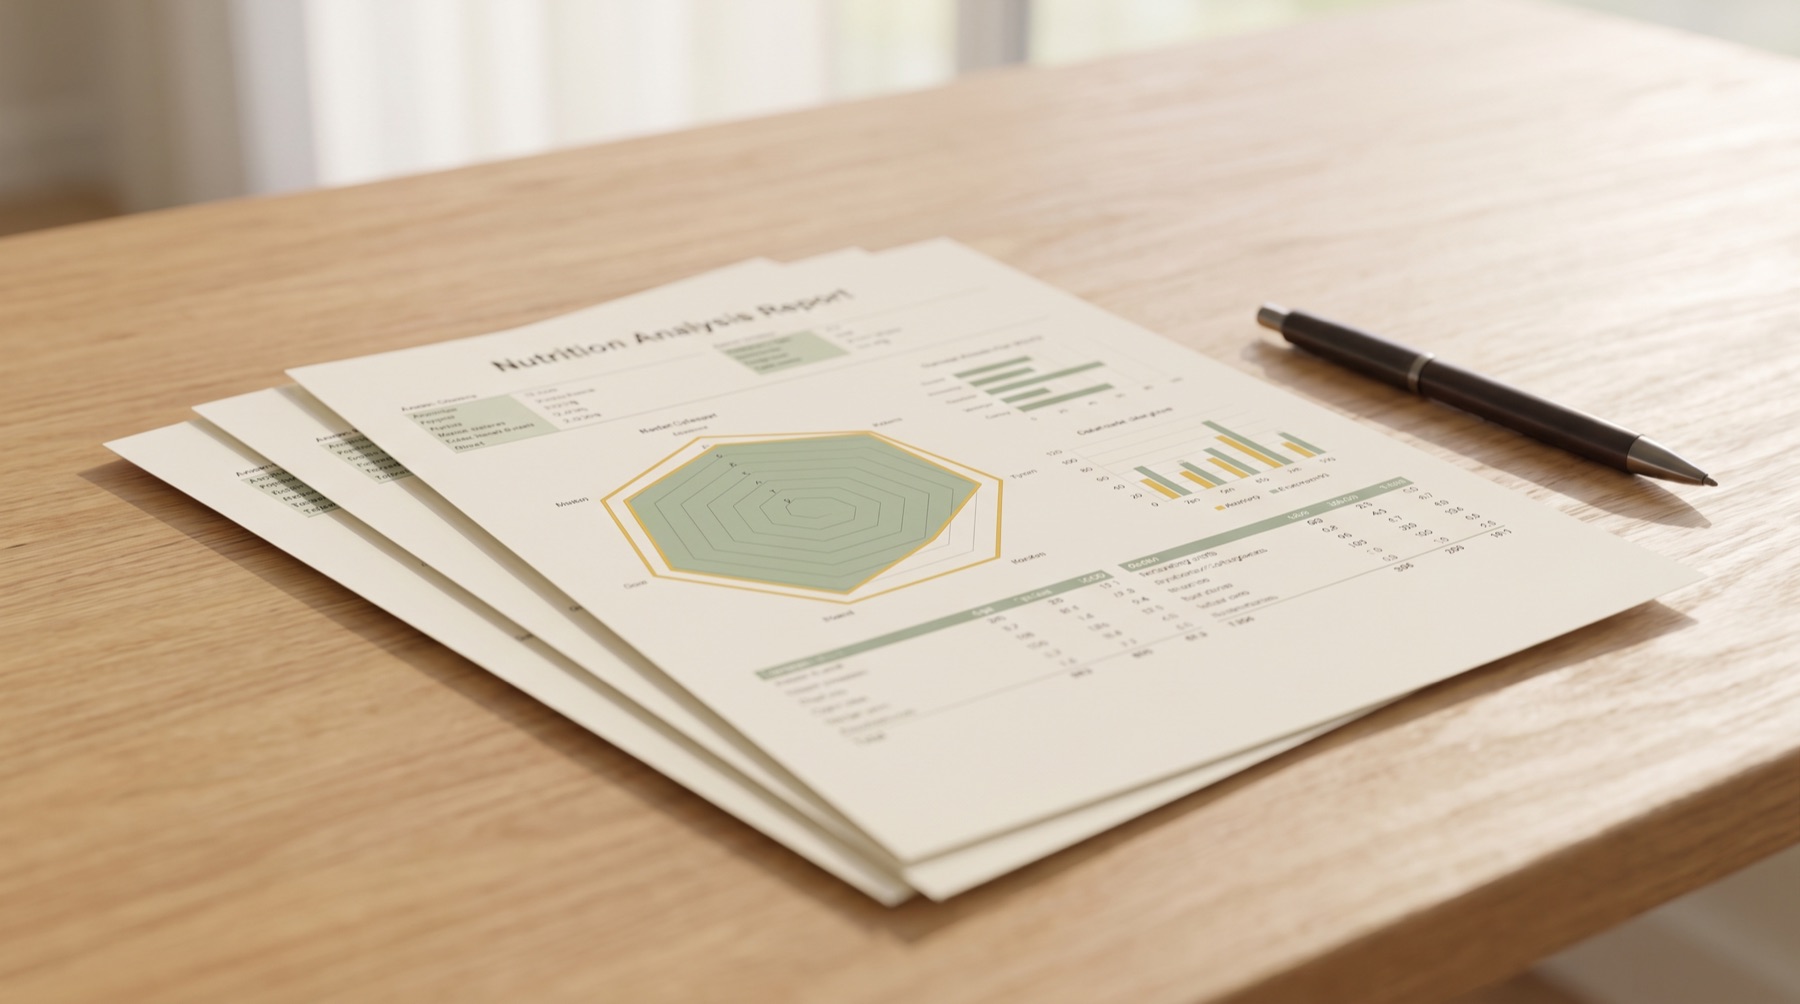
We developed a report that interprets blood tests using molecular nutrition and functional medicine, and assesses the status of each nutrient against an optimal range. We provide it in partnership with medical institutions. It shows changes that a standard “normal or abnormal” reference range can miss, and comes in two parts, one for the person tested and one for their doctor, so that the results lead to follow-up testing or changes in daily habits. Any diagnosis is made by the doctor.
02
Matching blood and urine tests with wearable data, and designing early flags
At the University of Tokyo Graduate School of Medicine, we are discussing where to begin research across several themes, including Physical AI, environmental medicine, and the role of insurance in preventive medicine.
03
Establishing and validating the algorithm with large-scale member data
By working with a company that already has a large membership, we aim to collect and process data at scale, and to use it to establish and validate an algorithm that raises these flags.
04
Building it into homes and stays (Wellness Residence)
Blood tests set the baseline and everyday data tracks the changes. The home, food and environment are where we intervene, and then we measure again. We are proposing and discussing ways to build this cycle into the places where people live and stay. We have also proposed a programme in which people are measured during a stay in a region and carry what they learn into daily life at home.
05
Preventive medicine, insurance, and how to define wellbeing and health
We are in discussions with a life insurance company about the role that preventive and longevity medicine can play. Working with academic partners, we plan to collect data and take on the question of how “health” and “wellbeing” should be defined and measured.
Collaborate with us
We welcome enquiries from universities, medical institutions, companies and local governments about joint research and business projects. You can also email us at [email protected].